![]()
Pynimate

![]()

![]()
Python package for statistical data animations.
Installation
with pip
You can install pynimate using pip
How to use
Pynimate expects pandas dataframe formatted in this manner:
Where the time column is set to index.
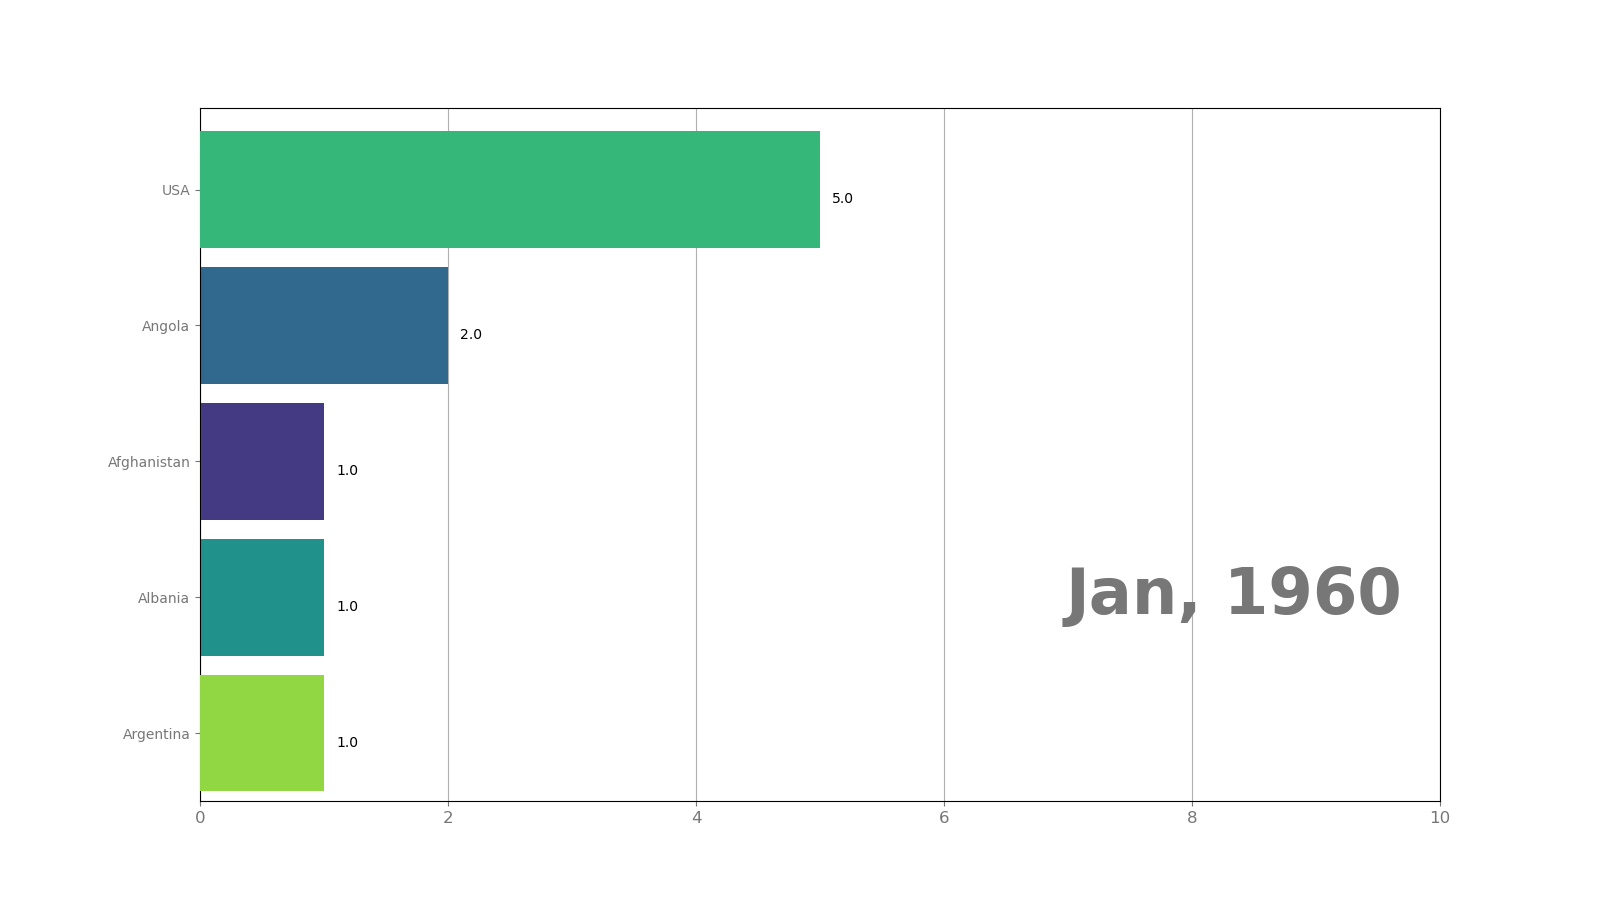
Bar Chart Example
import pandas as pd
from matplotlib import pyplot as plt

import pynimate as nim

df = pd.DataFrame(
    {
        "time": ["1960-01-01", "1961-01-01", "1962-01-01"],
        "Afghanistan": [1, 2, 3],
        "Angola": [2, 3, 4],
        "Albania": [1, 2, 5],
        "USA": [5, 3, 4],
        "Argentina": [1, 4, 5],
    }
).set_index("time")

cnv = nim.Canvas()
bar = nim.Barhplot.from_df(df, "%Y-%m-%d", "2d")
bar.set_time(callback=lambda i, datafier: datafier.data.index[i].strftime("%b, %Y"))
cnv.add_plot(bar)
cnv.animate()
plt.show()